Native WebLogic Monitoring
WLSDM is an enterprise "WebLogic console extension" which enables monitoring for WebLogic JMX MBean metrics and all the WebLogic domain assets (Health, Servers, Applications, Data Sources, JMS… etc.). It is very easy to create alarm and notification definitions by using the WLSDM metric browser. WLSDM can store any WebLogic metric value historically and also can generate graphical reports.
Expert Support Team
Our support team is ready to solve your problems.
Need to Learn More?
If you need to learn more about WLSDM, let's schedule a demo.
Documentation
Need More
WLSDM: Key Features
...by using WLSDM:
You can see and understand what is happening inside your WebLogic domain. "WLSDM for WebLogic" console extension is the best way to reflect your WebLogic knowledge to the mission-critical WebLogic domains. You can monitor WebLogic states, health status, and back-end activities (SQL, EJB, JAXWS...) easily and fast. WLSDM never creates additional load on your JVM instances. WLSDM reads the WebLogic domain and recommends important metrics to monitor then you can visualize and create custom alarms for your WebLogic domains. Move forward your service and WebLogic administration quality!
Important WLSDM Features
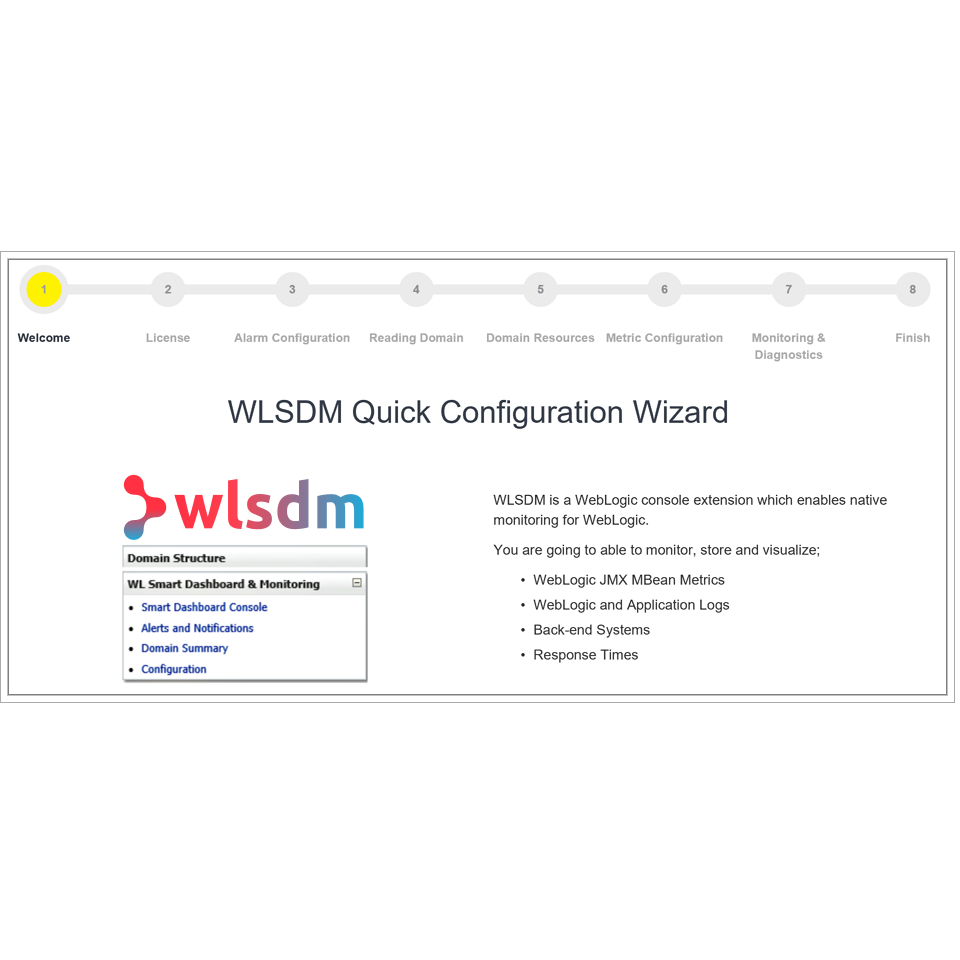
Quick Configuration Wizard
Responsive UI
Historical Data and Reports
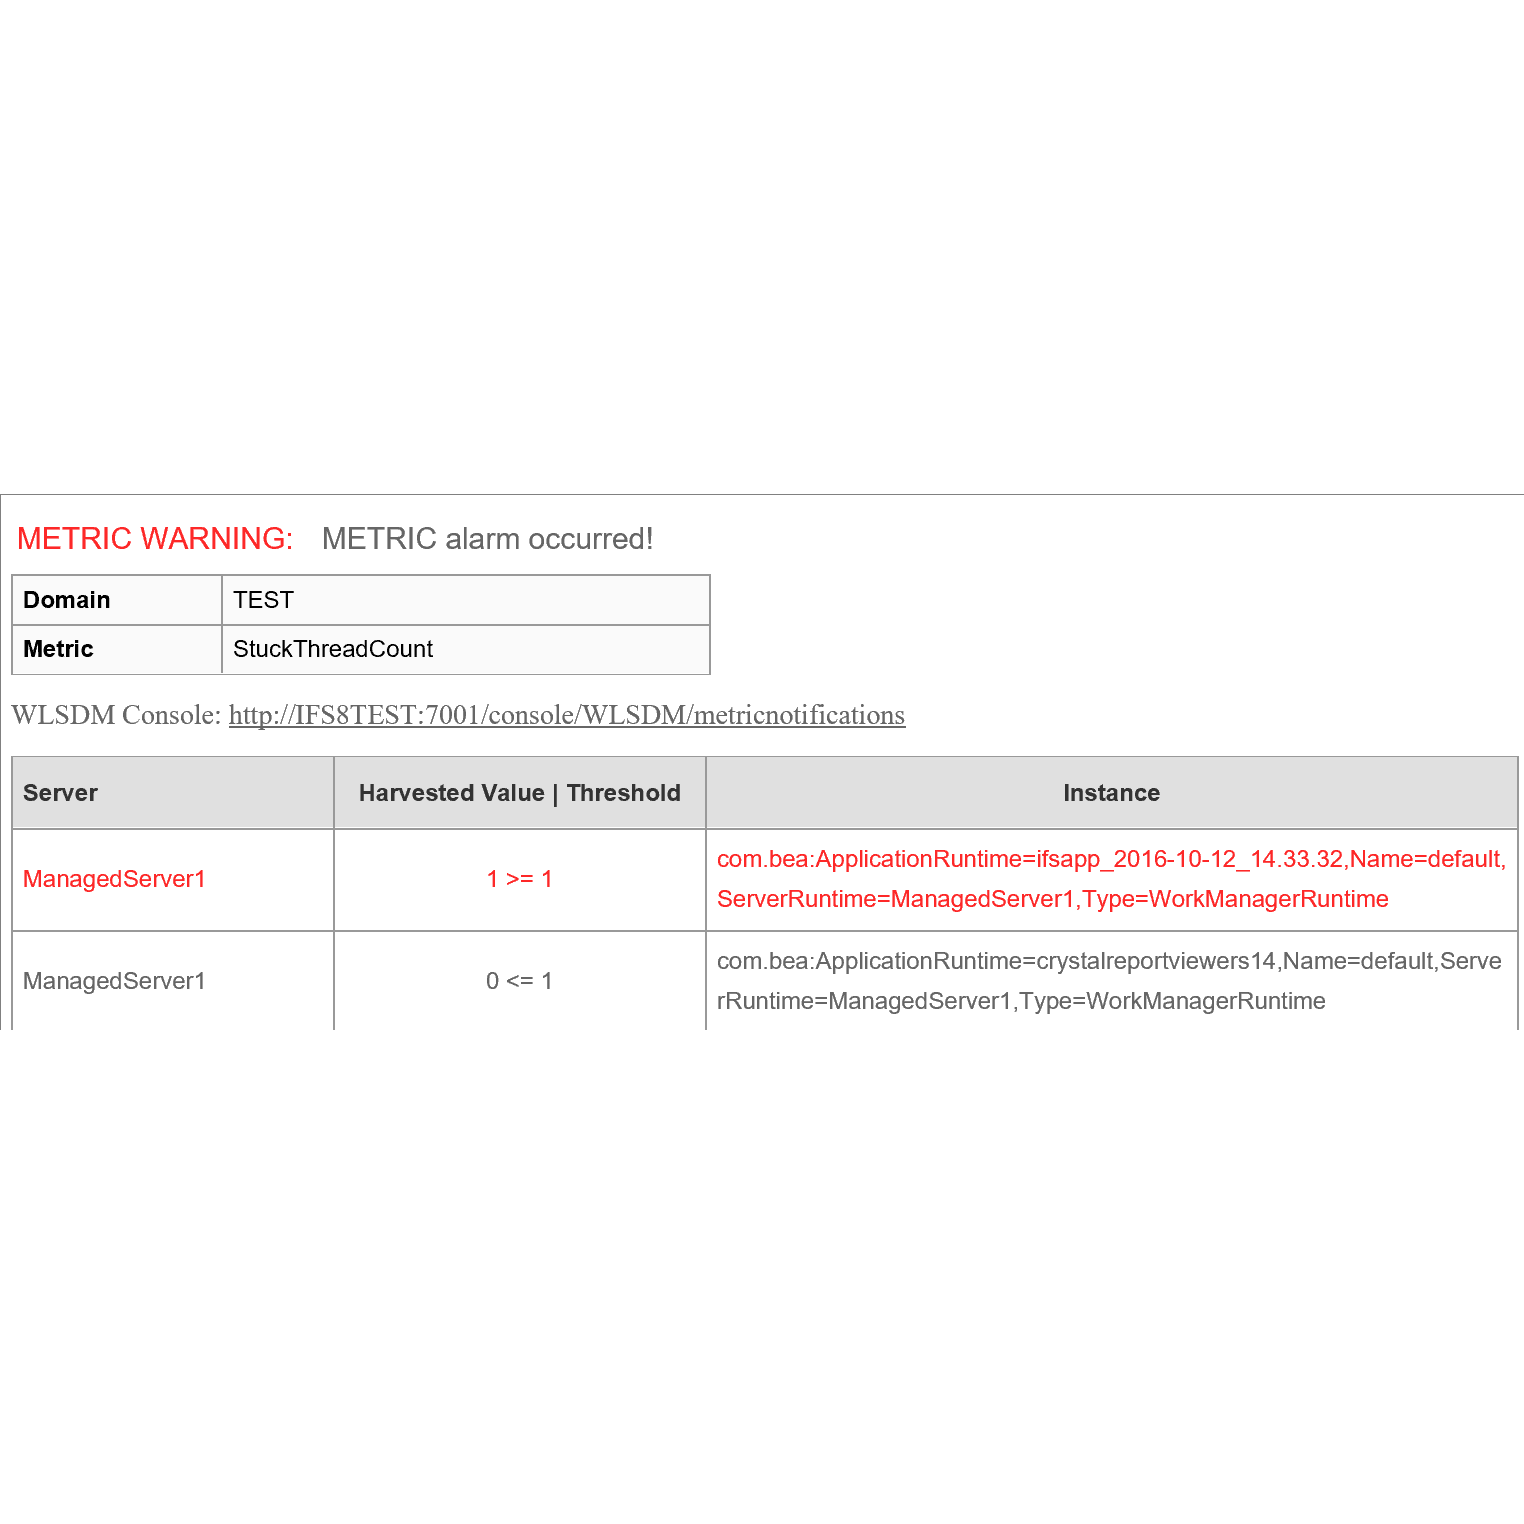
Monitoring JMX MBean Objects
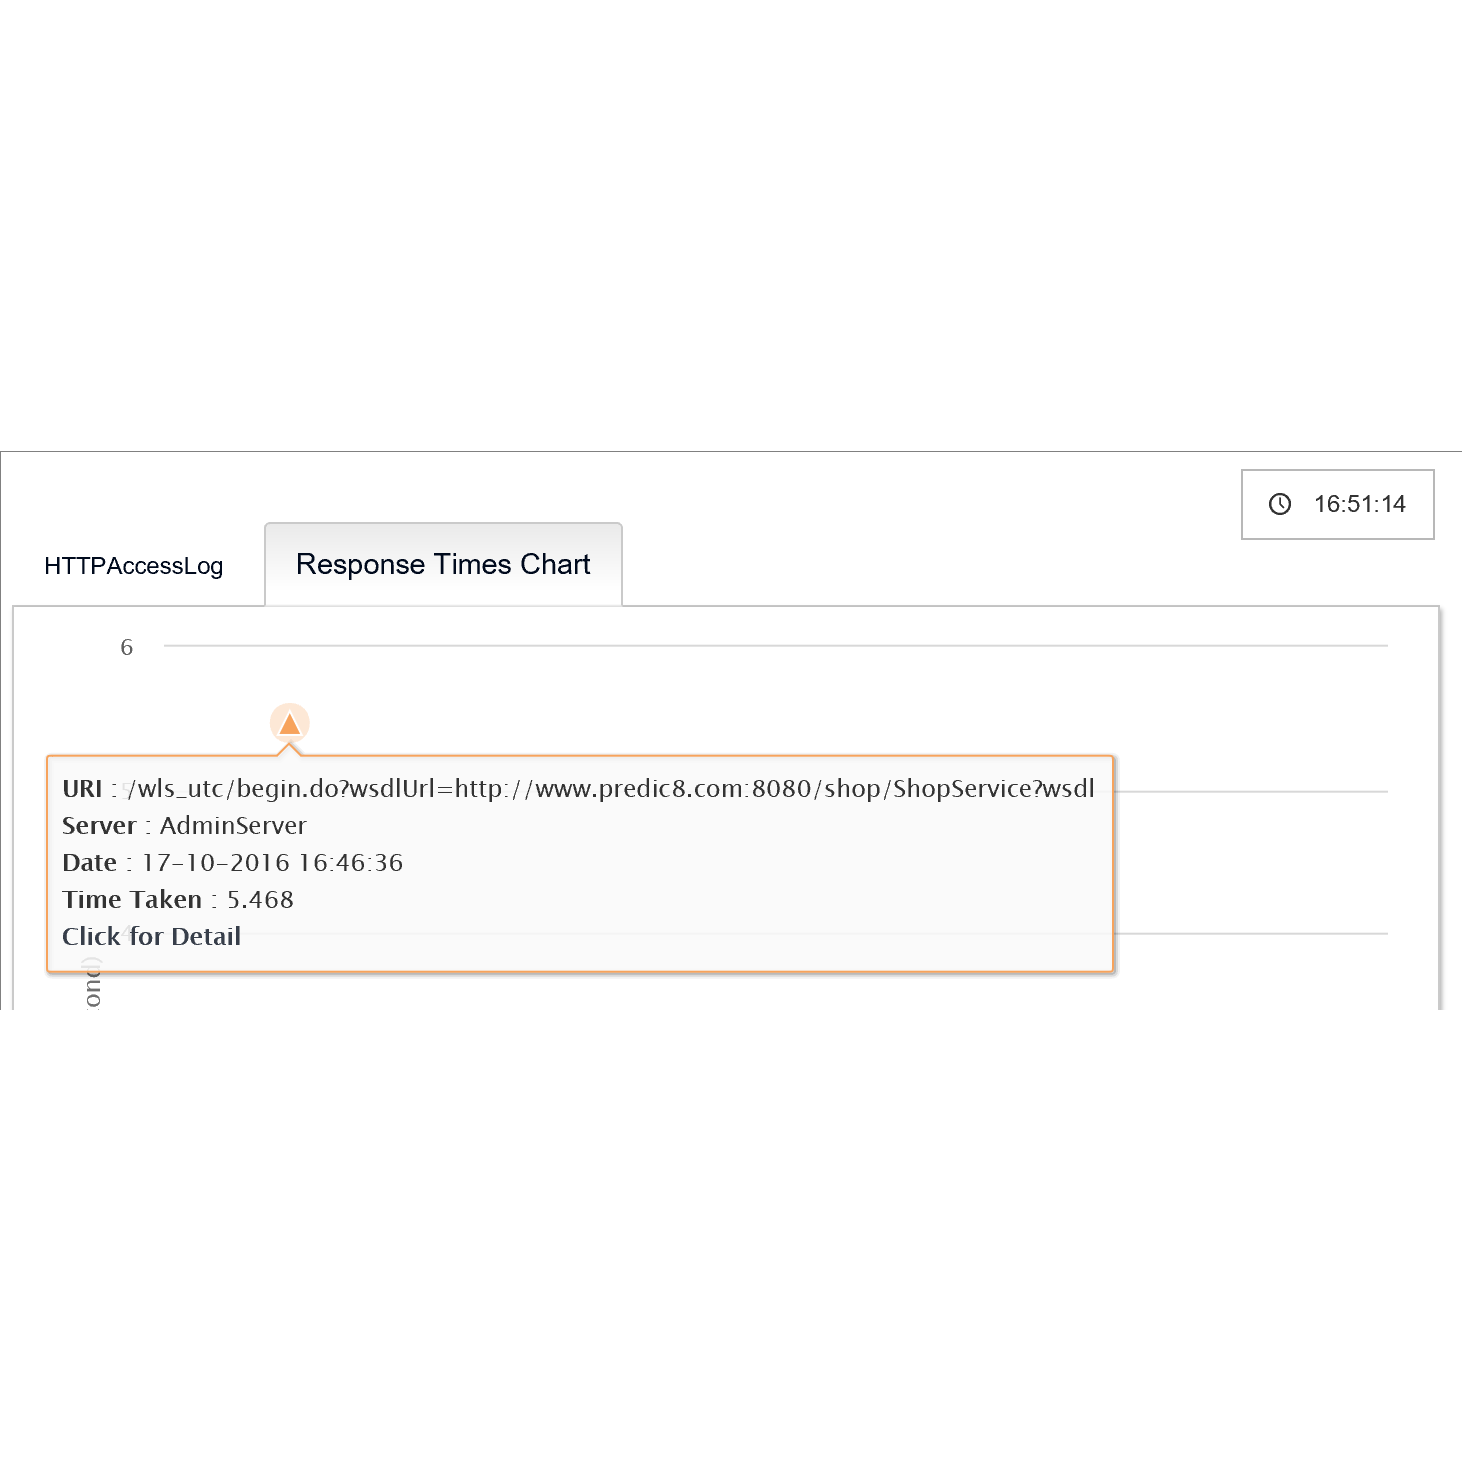
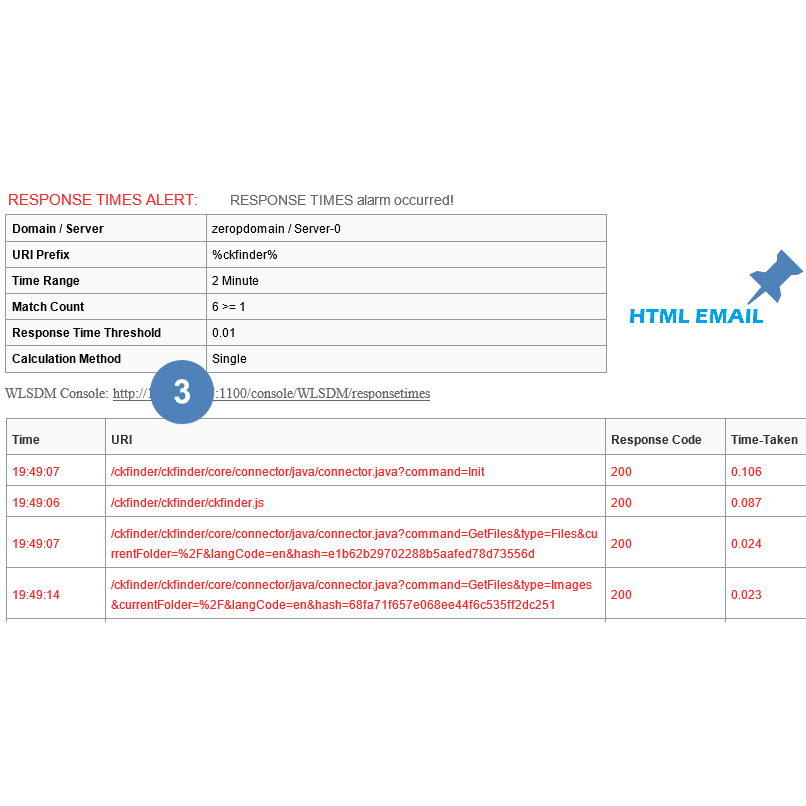
Monitoring Application Response Times
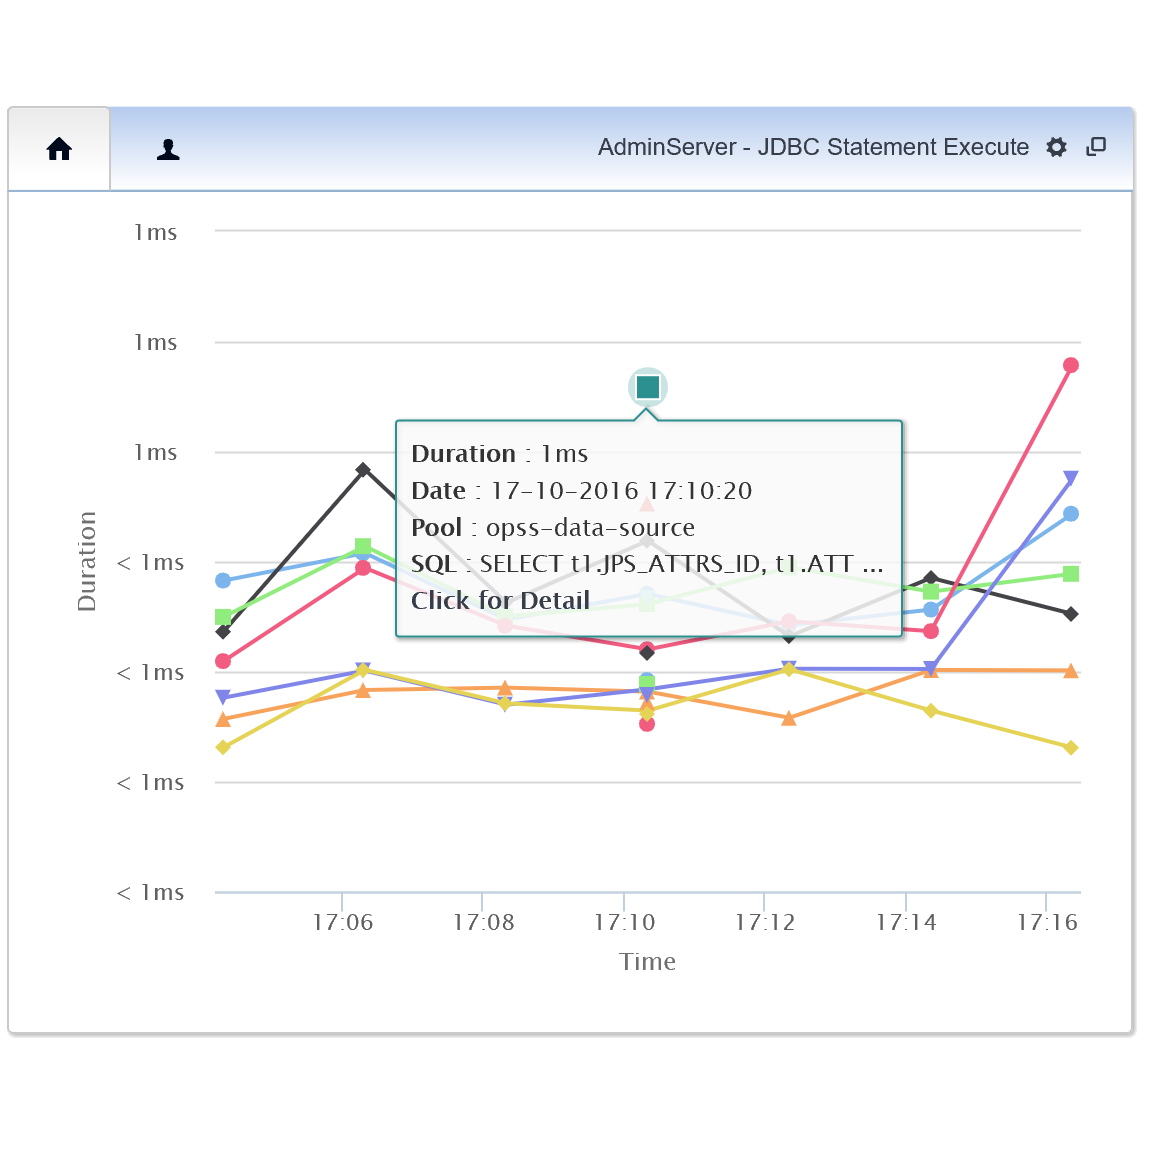
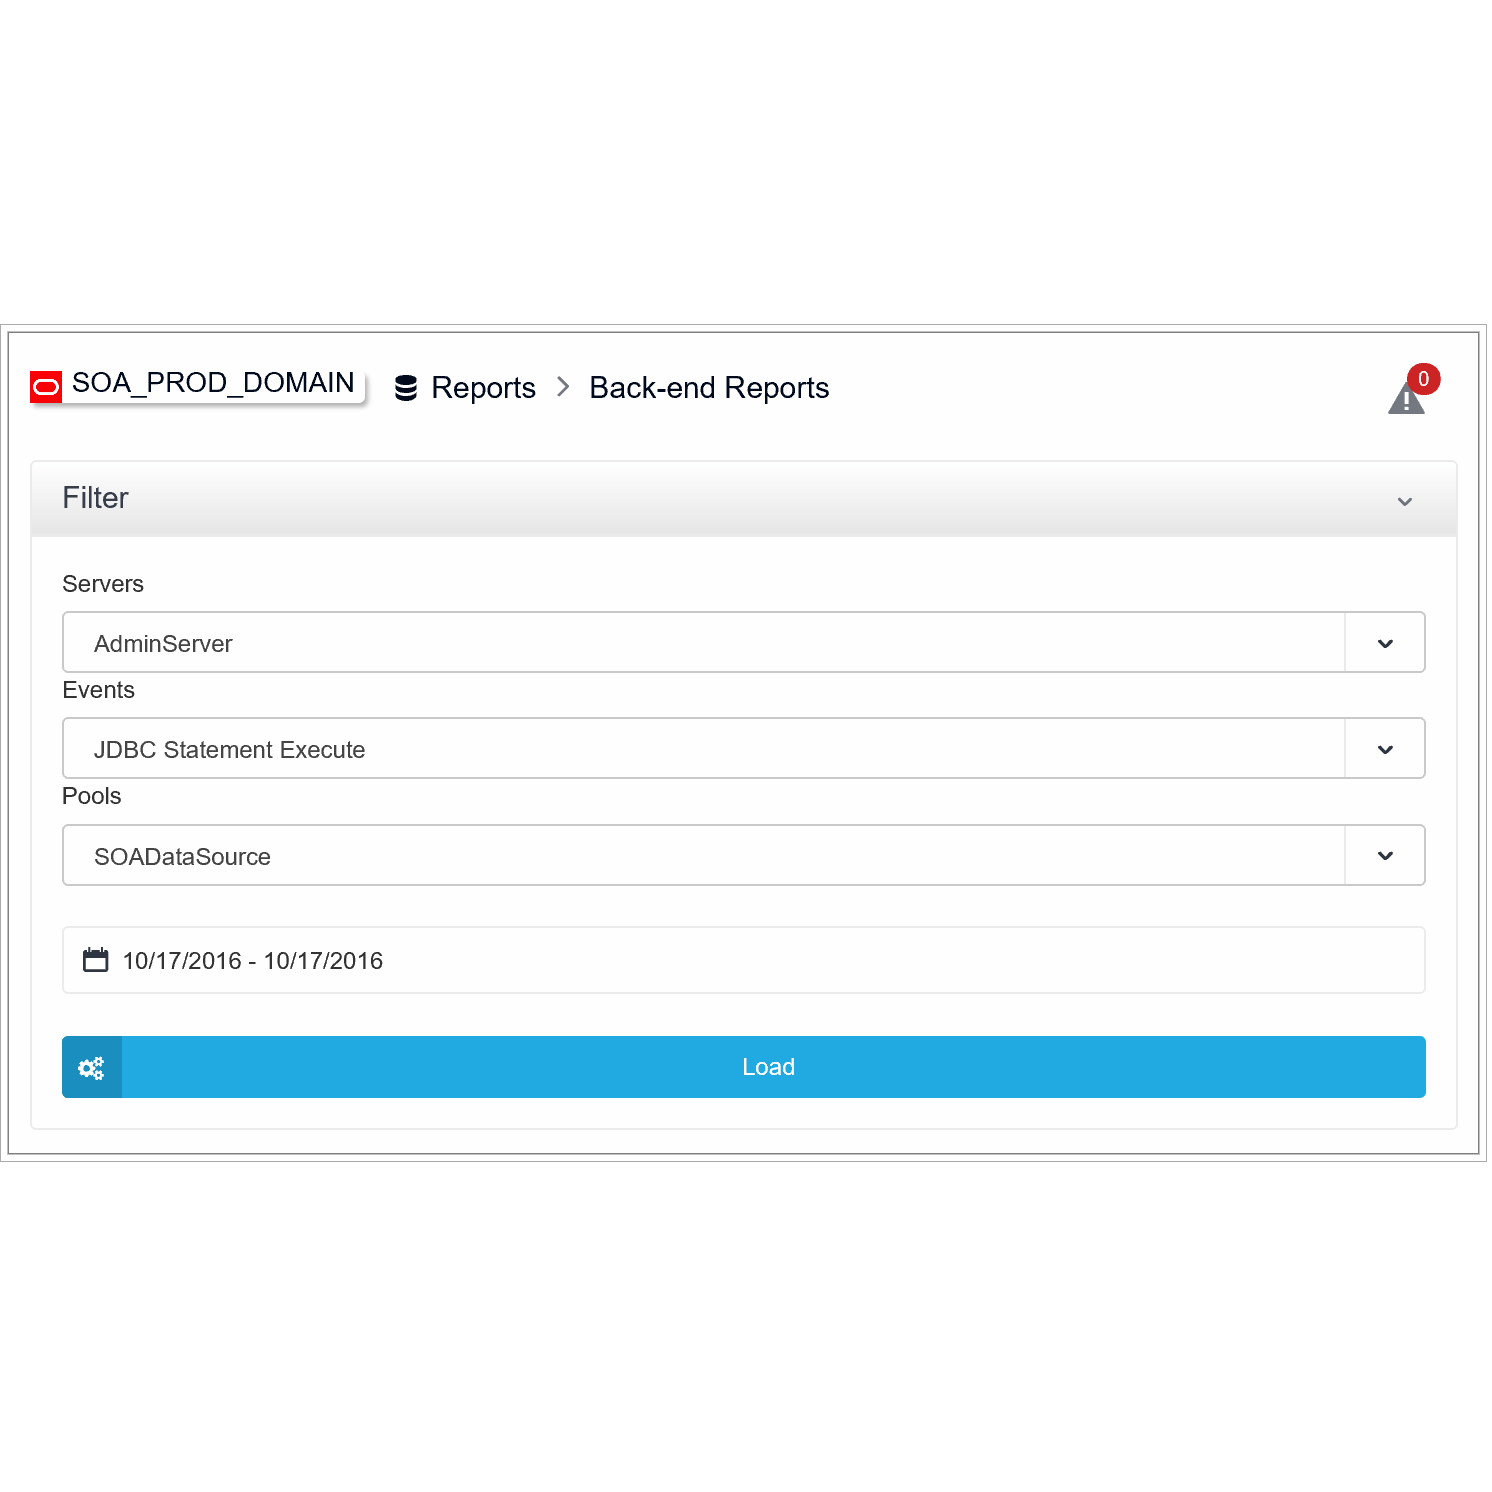
Monitoring Back-End Resources
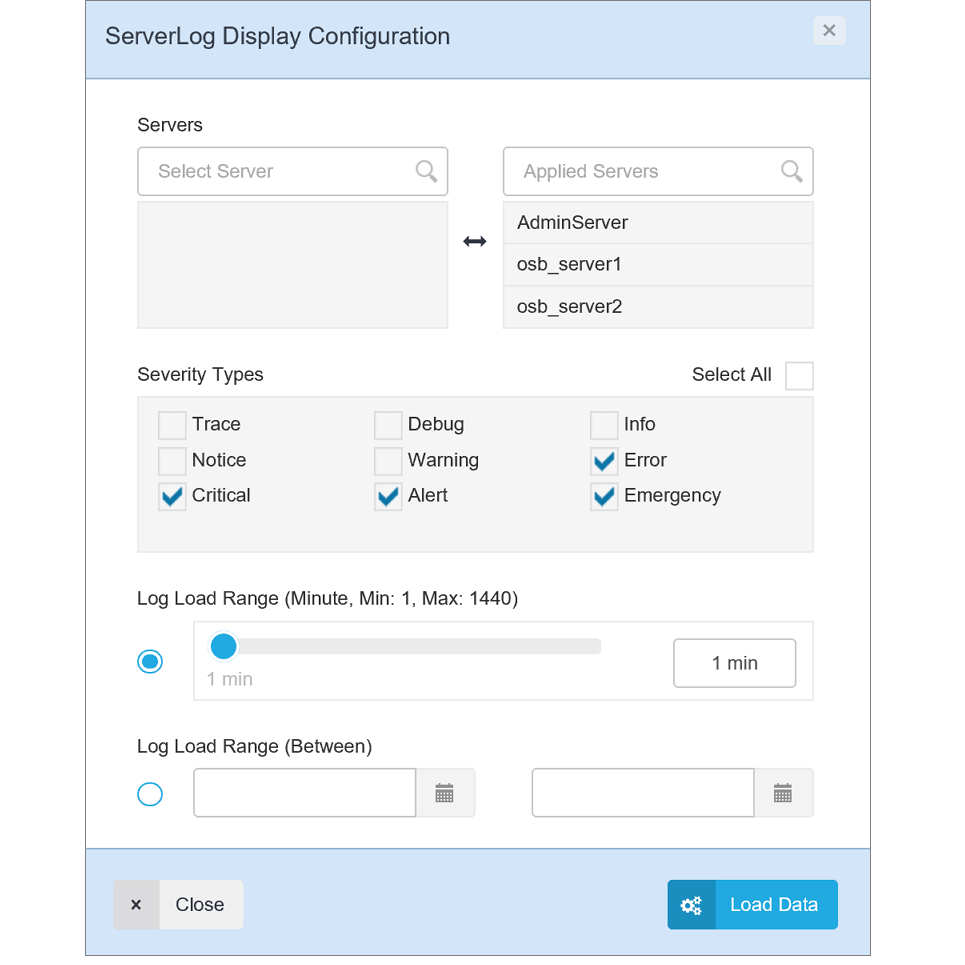
Monitoring WebLogic Logs: LogInspector
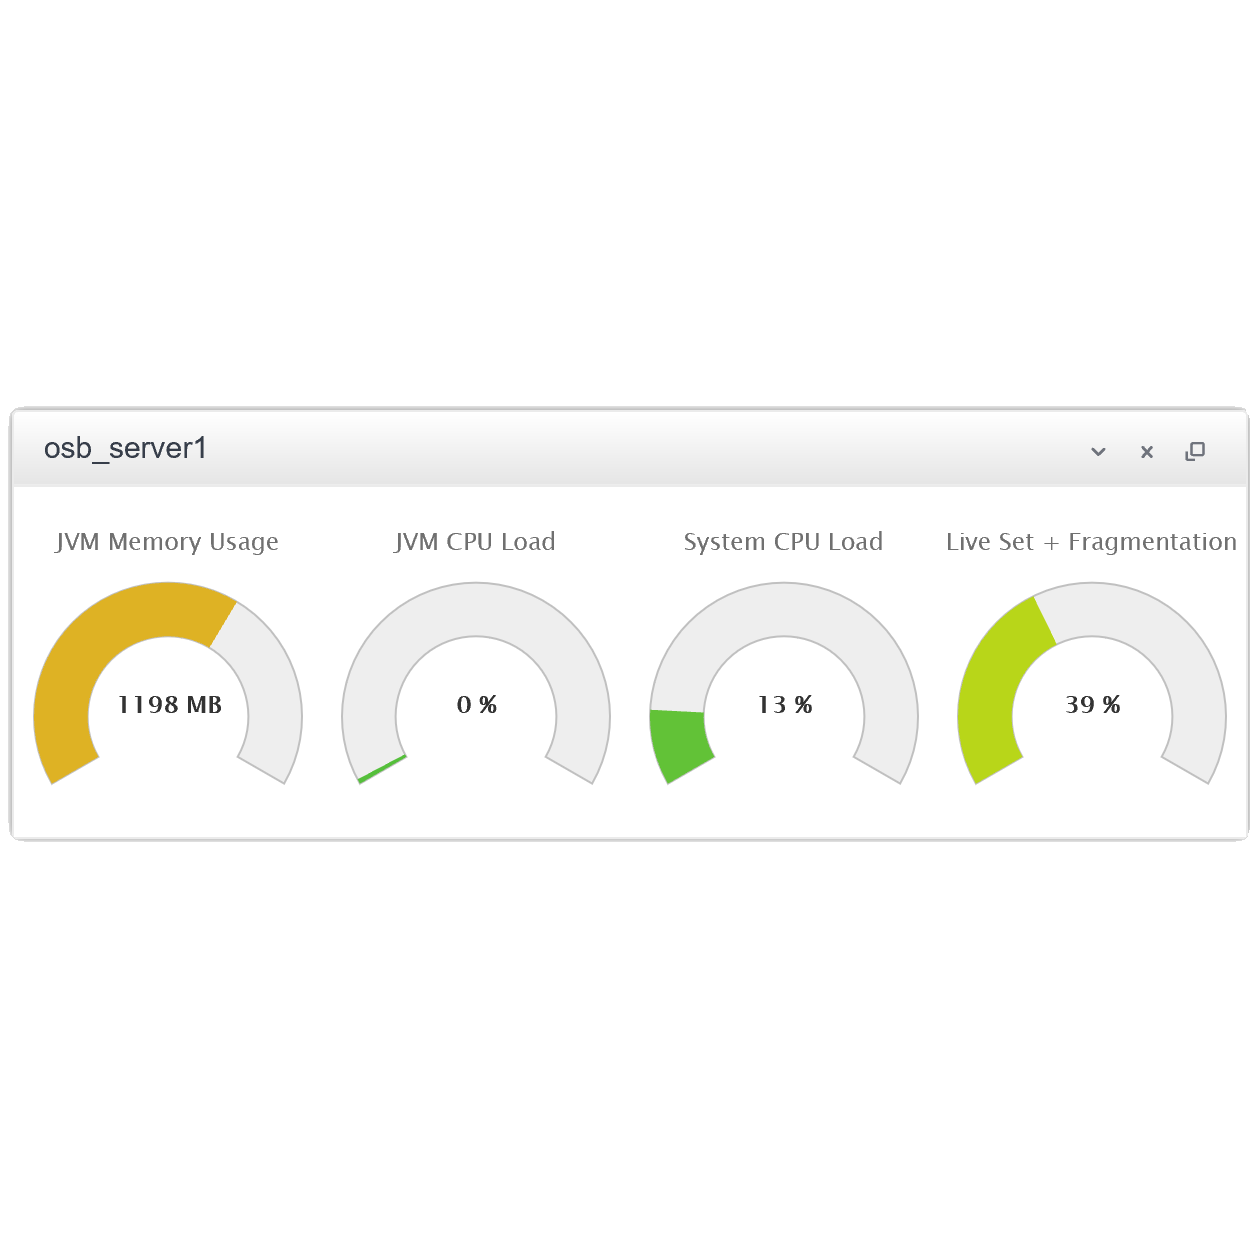
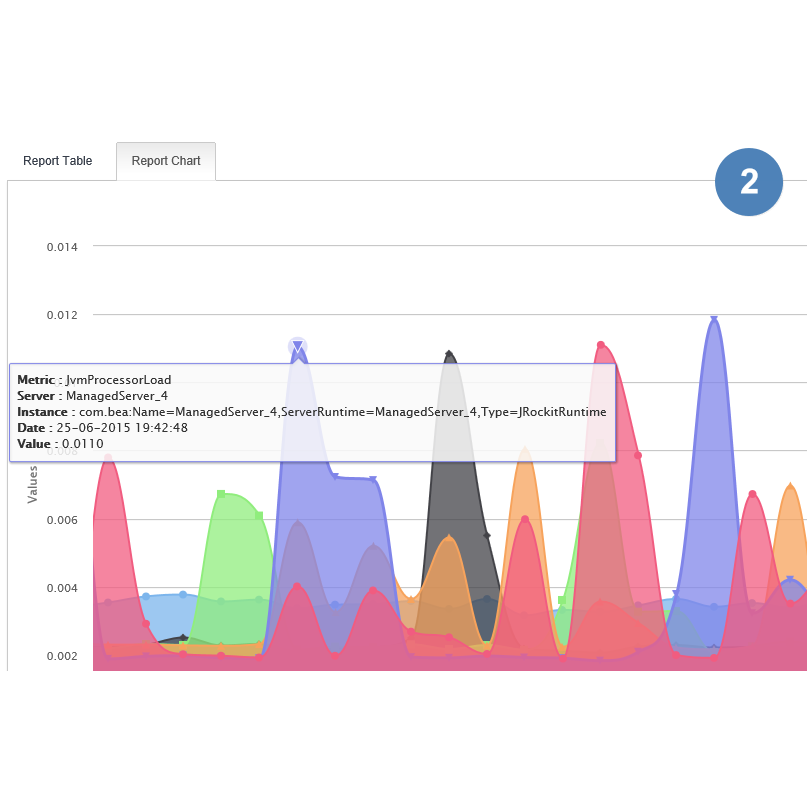
Monitoring WebLogic JVM Resources
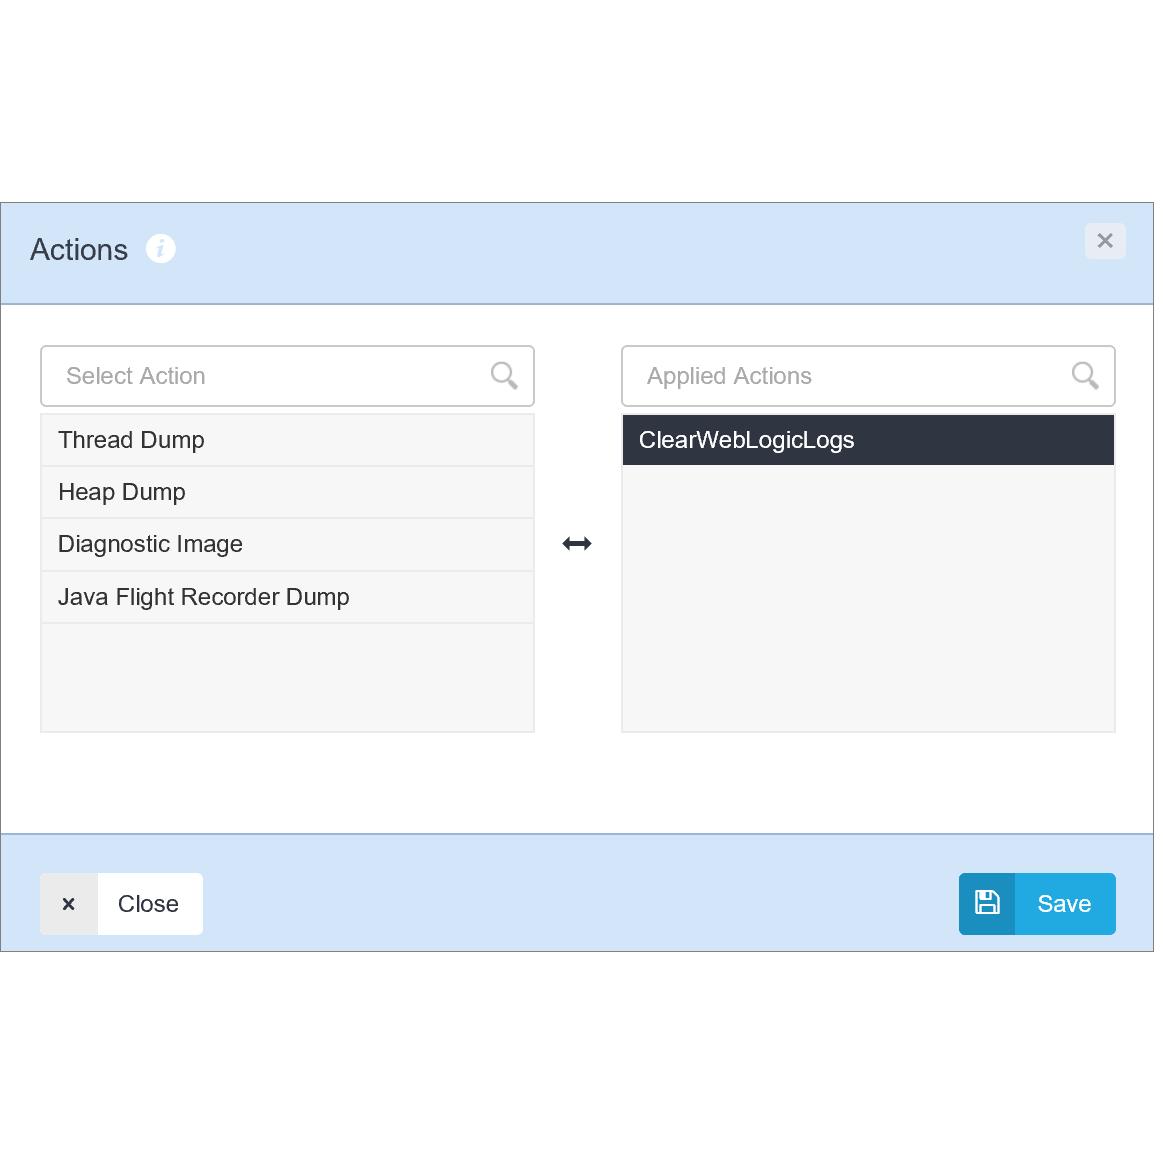
Profiling Dumps and Custom Actions
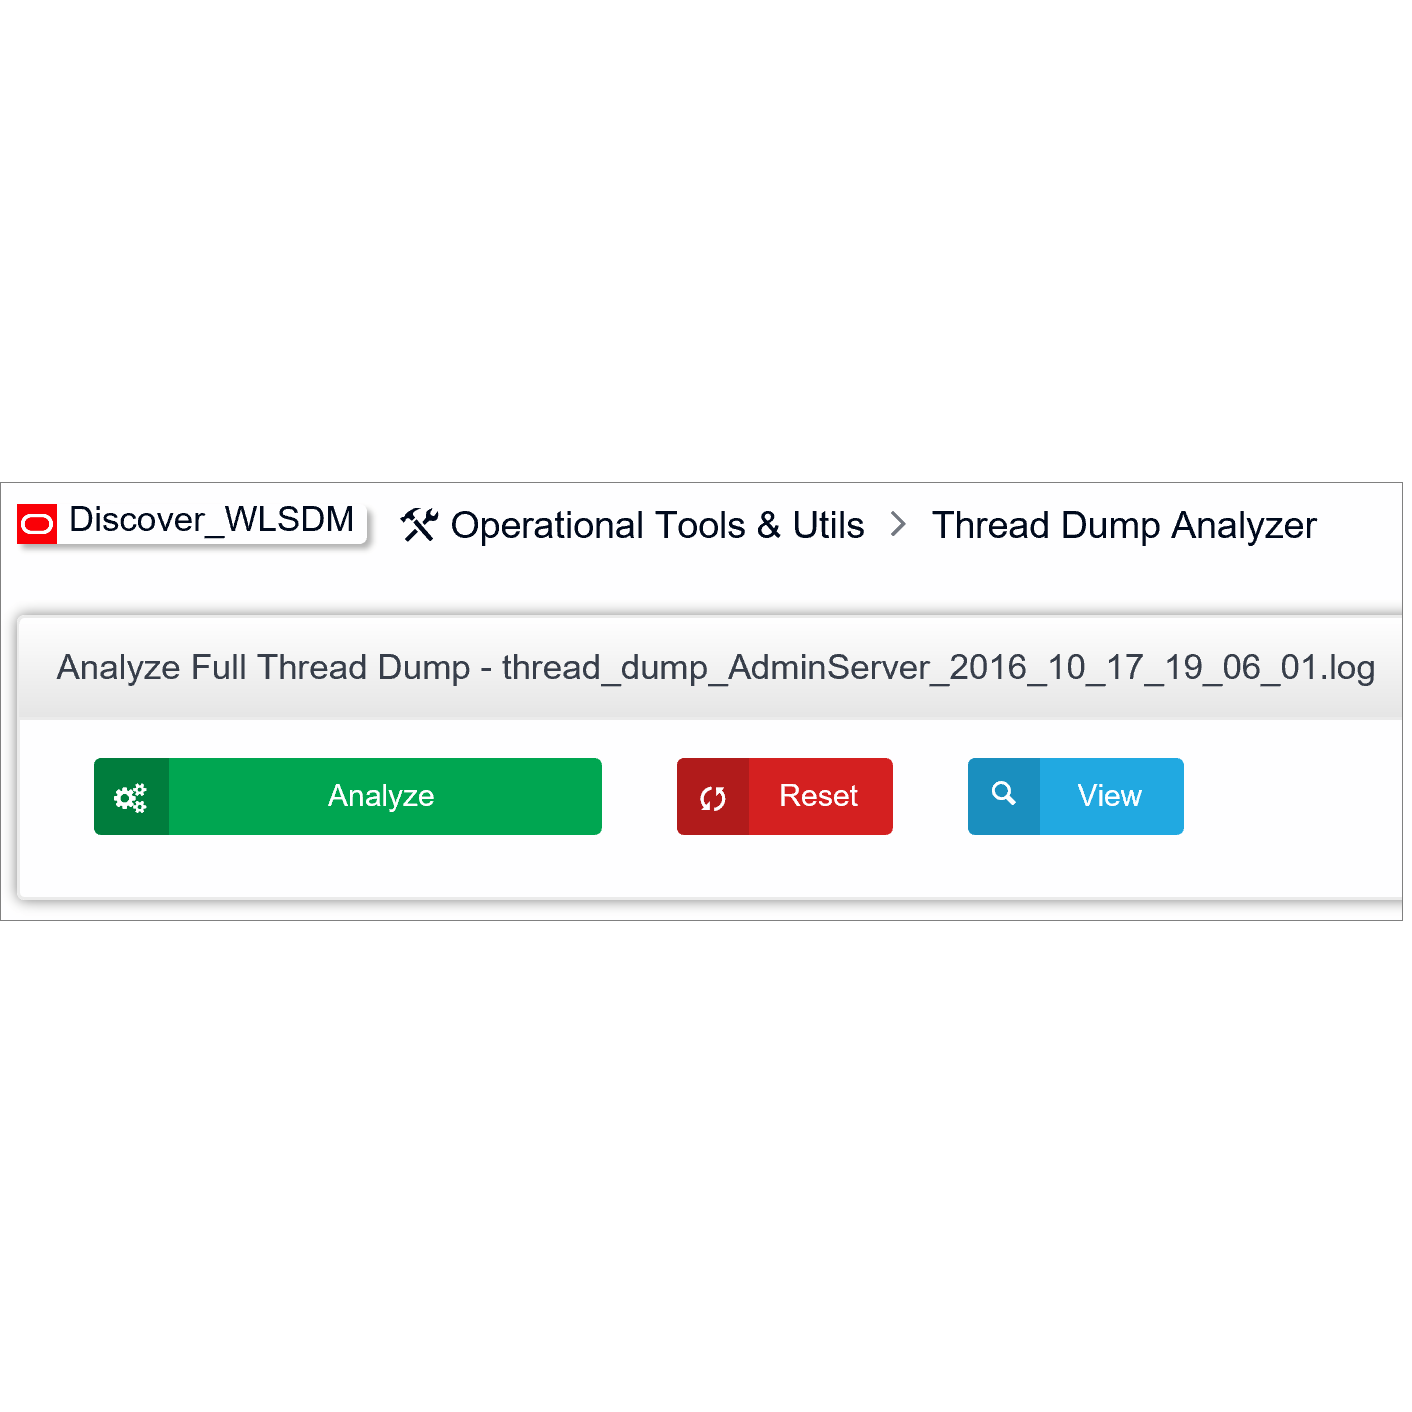
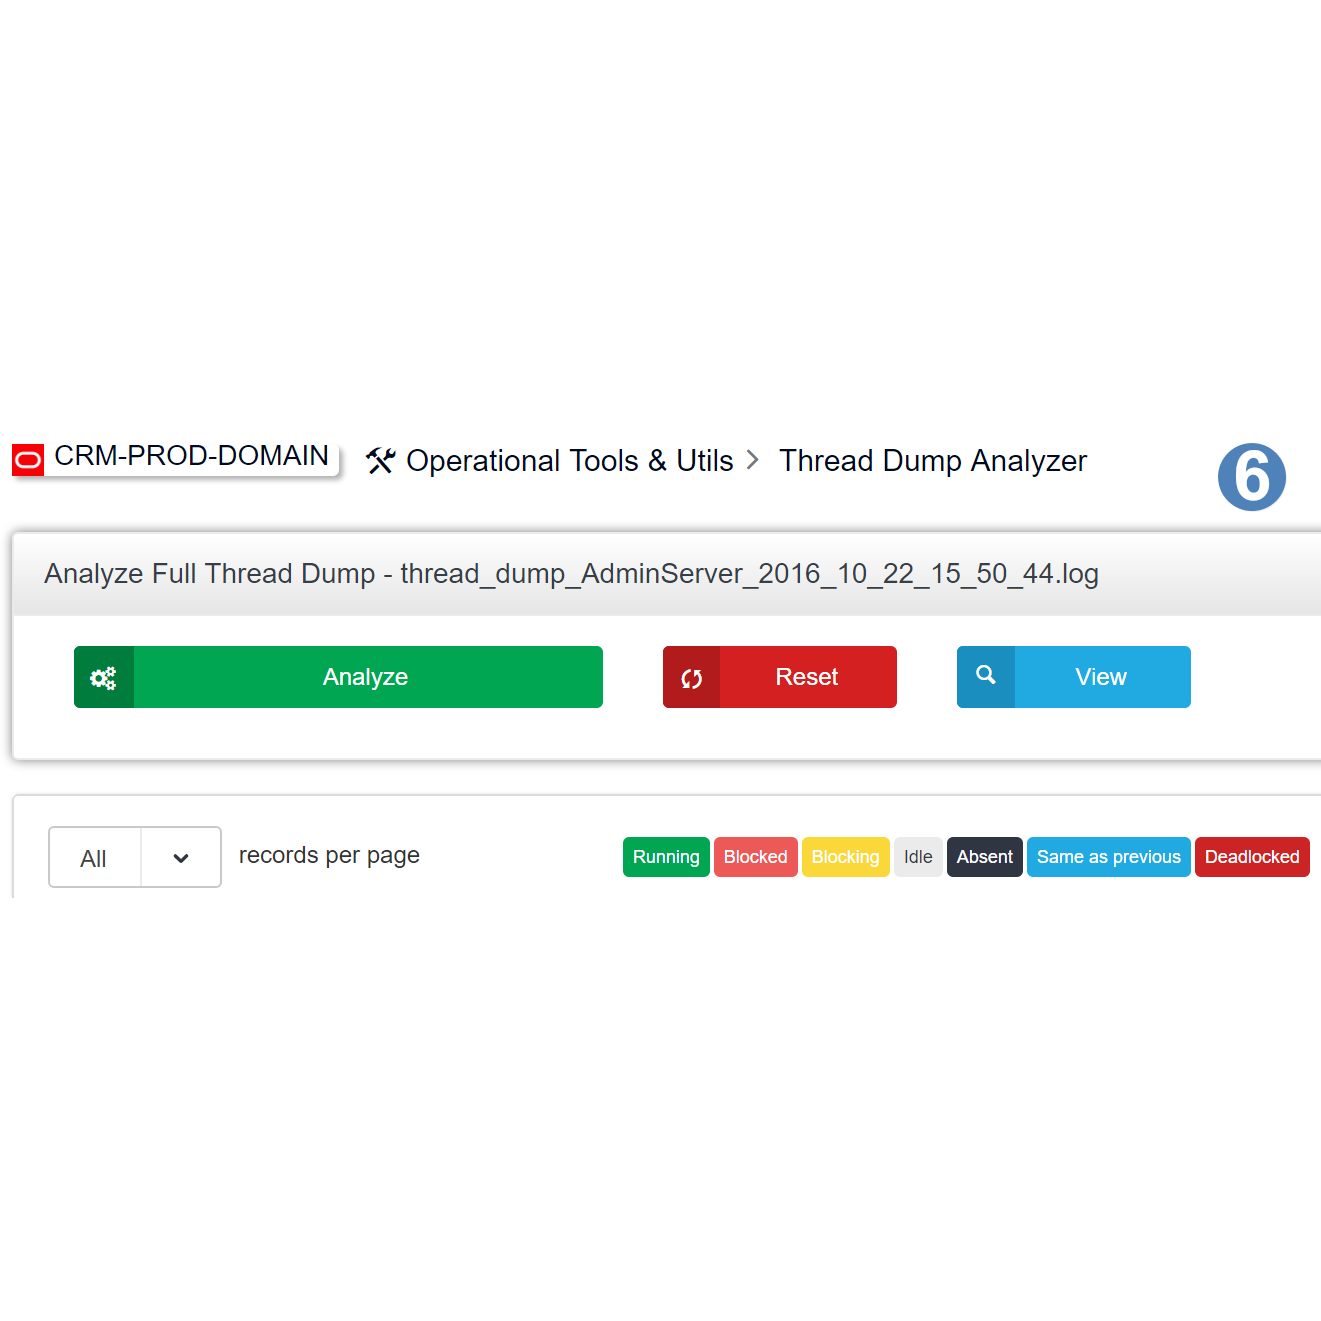
Thread Dump Analyzer
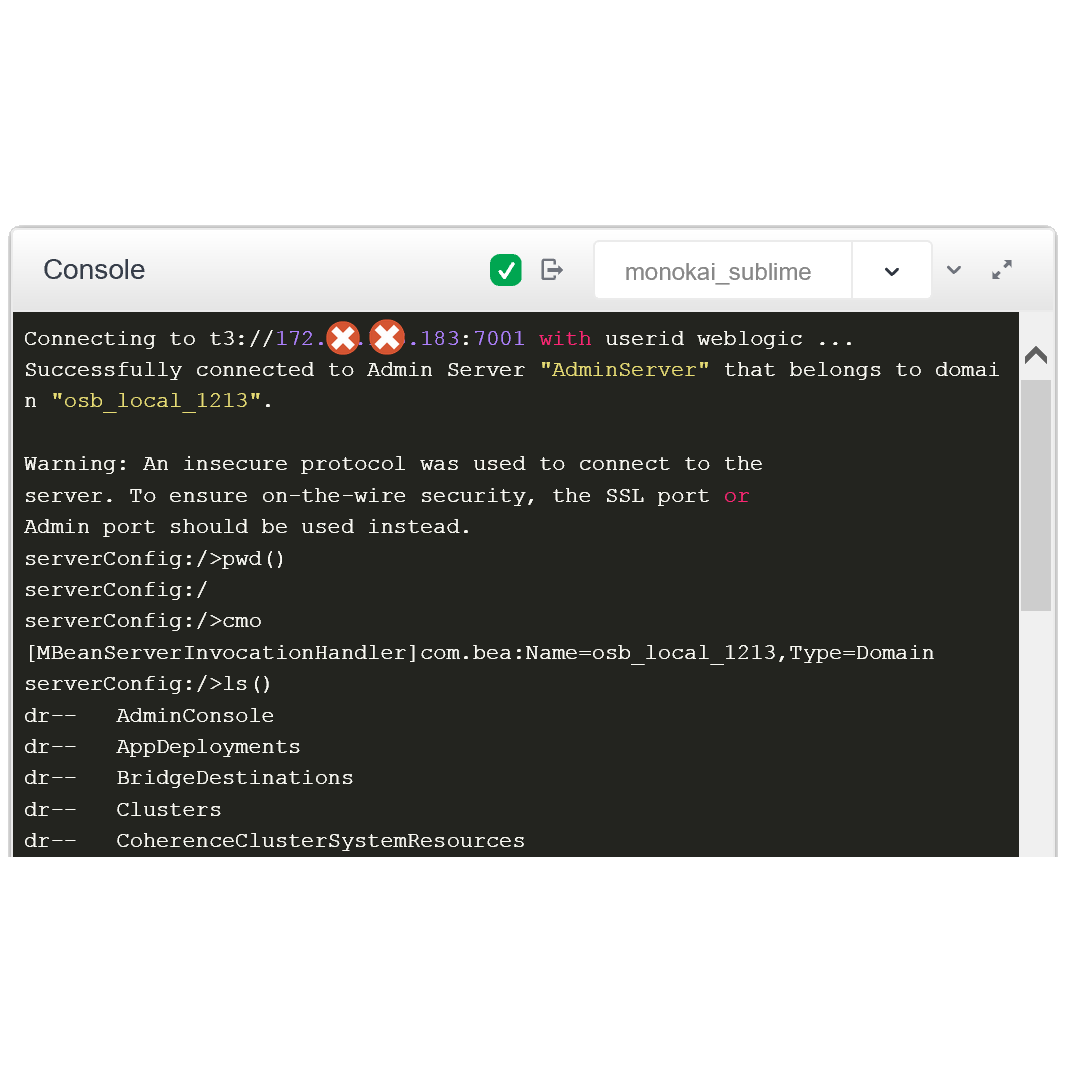
WLST Web Console
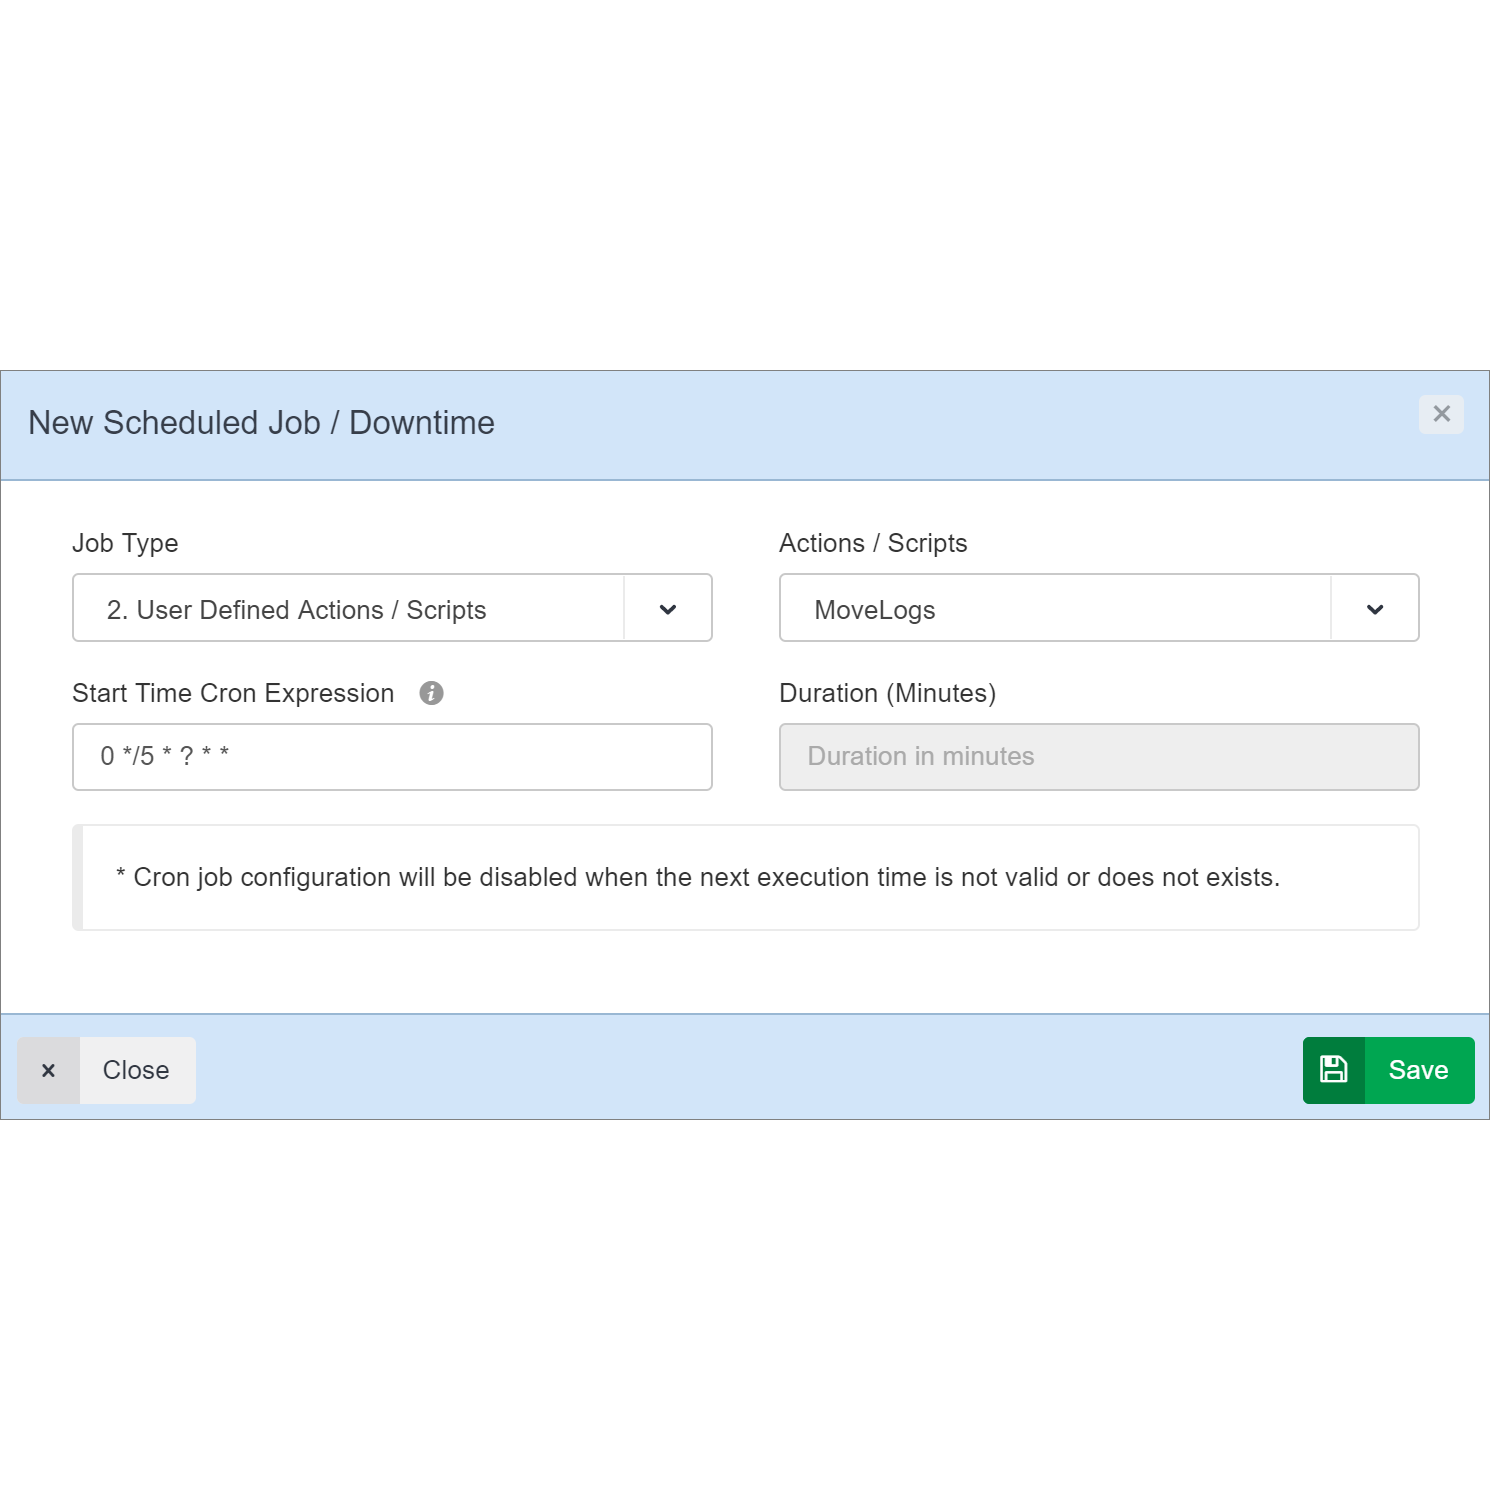
Scheduler Module
...and much more!
- WebLogic Health and State History
- WebLogic Managed Server(s), Deployments, Data Sources and JMS Health and State Monitoring & Dashboard
- WebLogic Managed Server(s), Deployments, Data Sources and JMS JMX MBean Metric Monitoring & Dashboard
- Unlimited User Defined JMX Metric Monitoring & Dashboard
- JVM System Resources Monitoring: Heap, CPU
- Log Monitoring & Notifications
- Response Time Monitoring & Notifications
- Back-end Systems Dashboard, Monitoring & Notifications
- Profiling Dumps
- User Defined JMX Metric Actions
- Metric Reports
- Back-end System Reports
- Log Viewer & Tailer
- WLST Web Console
- Thread Dump Analyzer
- Decrypt & Encrypt Tool
- WebLogic Domain Overview (Summary)
- Domain Time-out Values Summary
- JMX Metric Browser
- JMX MBean Search
- Email (SMTP) and Trap (SNMP) Notification Support
- Customizable HTML Email Templates
- Automated Data Archiving
- Independent/Standalone Admin Server Monitoring
NEED TO LEARN MORE?
If you need to learn more about WLSDM, lets schedule a demo.
Functional and Easy Usage
JMX Metric MBean Value Database
SMTP and SNMP Support
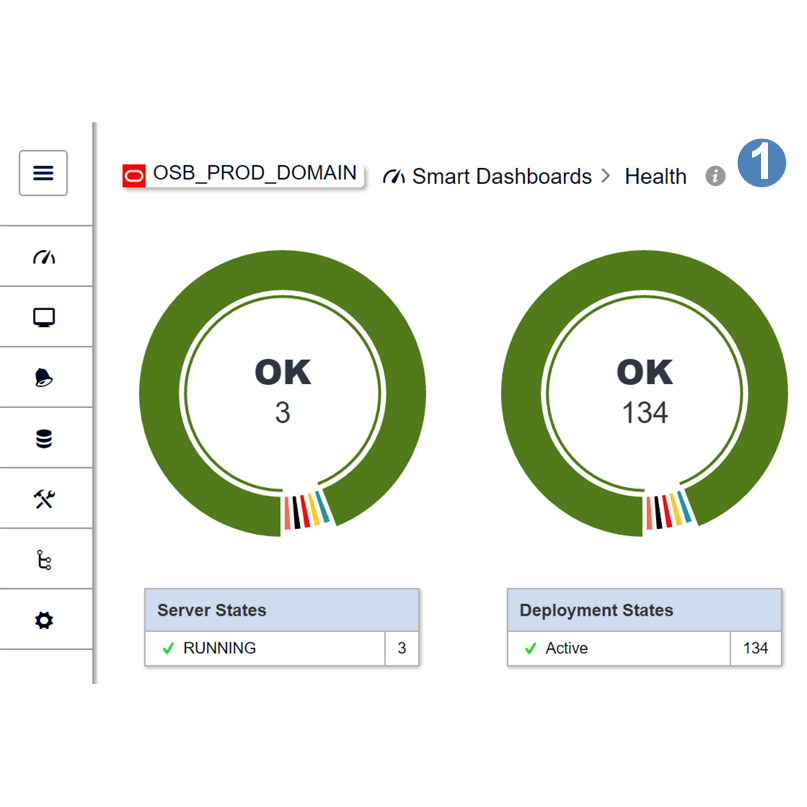
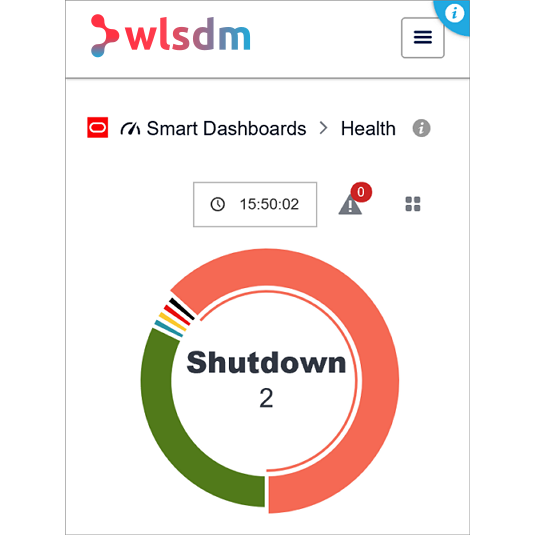
HEALTH Dashboard and Monitoring
Historical Data: Store WebLogic MBean Metrics
Monitor Application Response Times
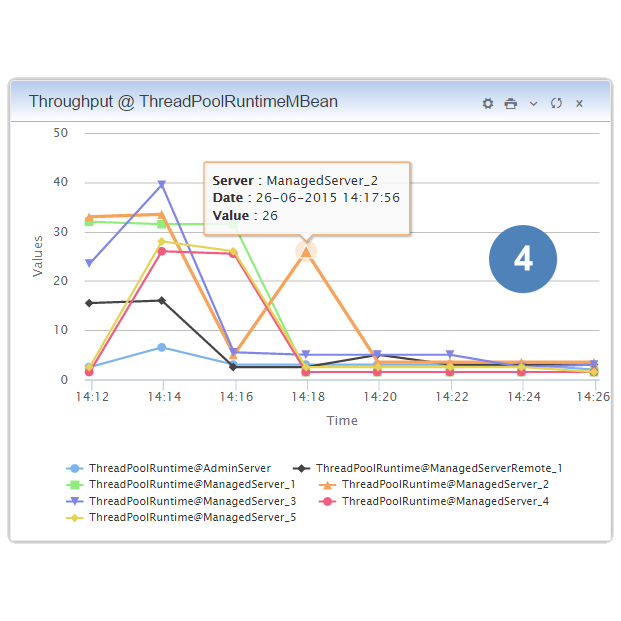
Monitor and Visualize WebLogic MBean Metrics
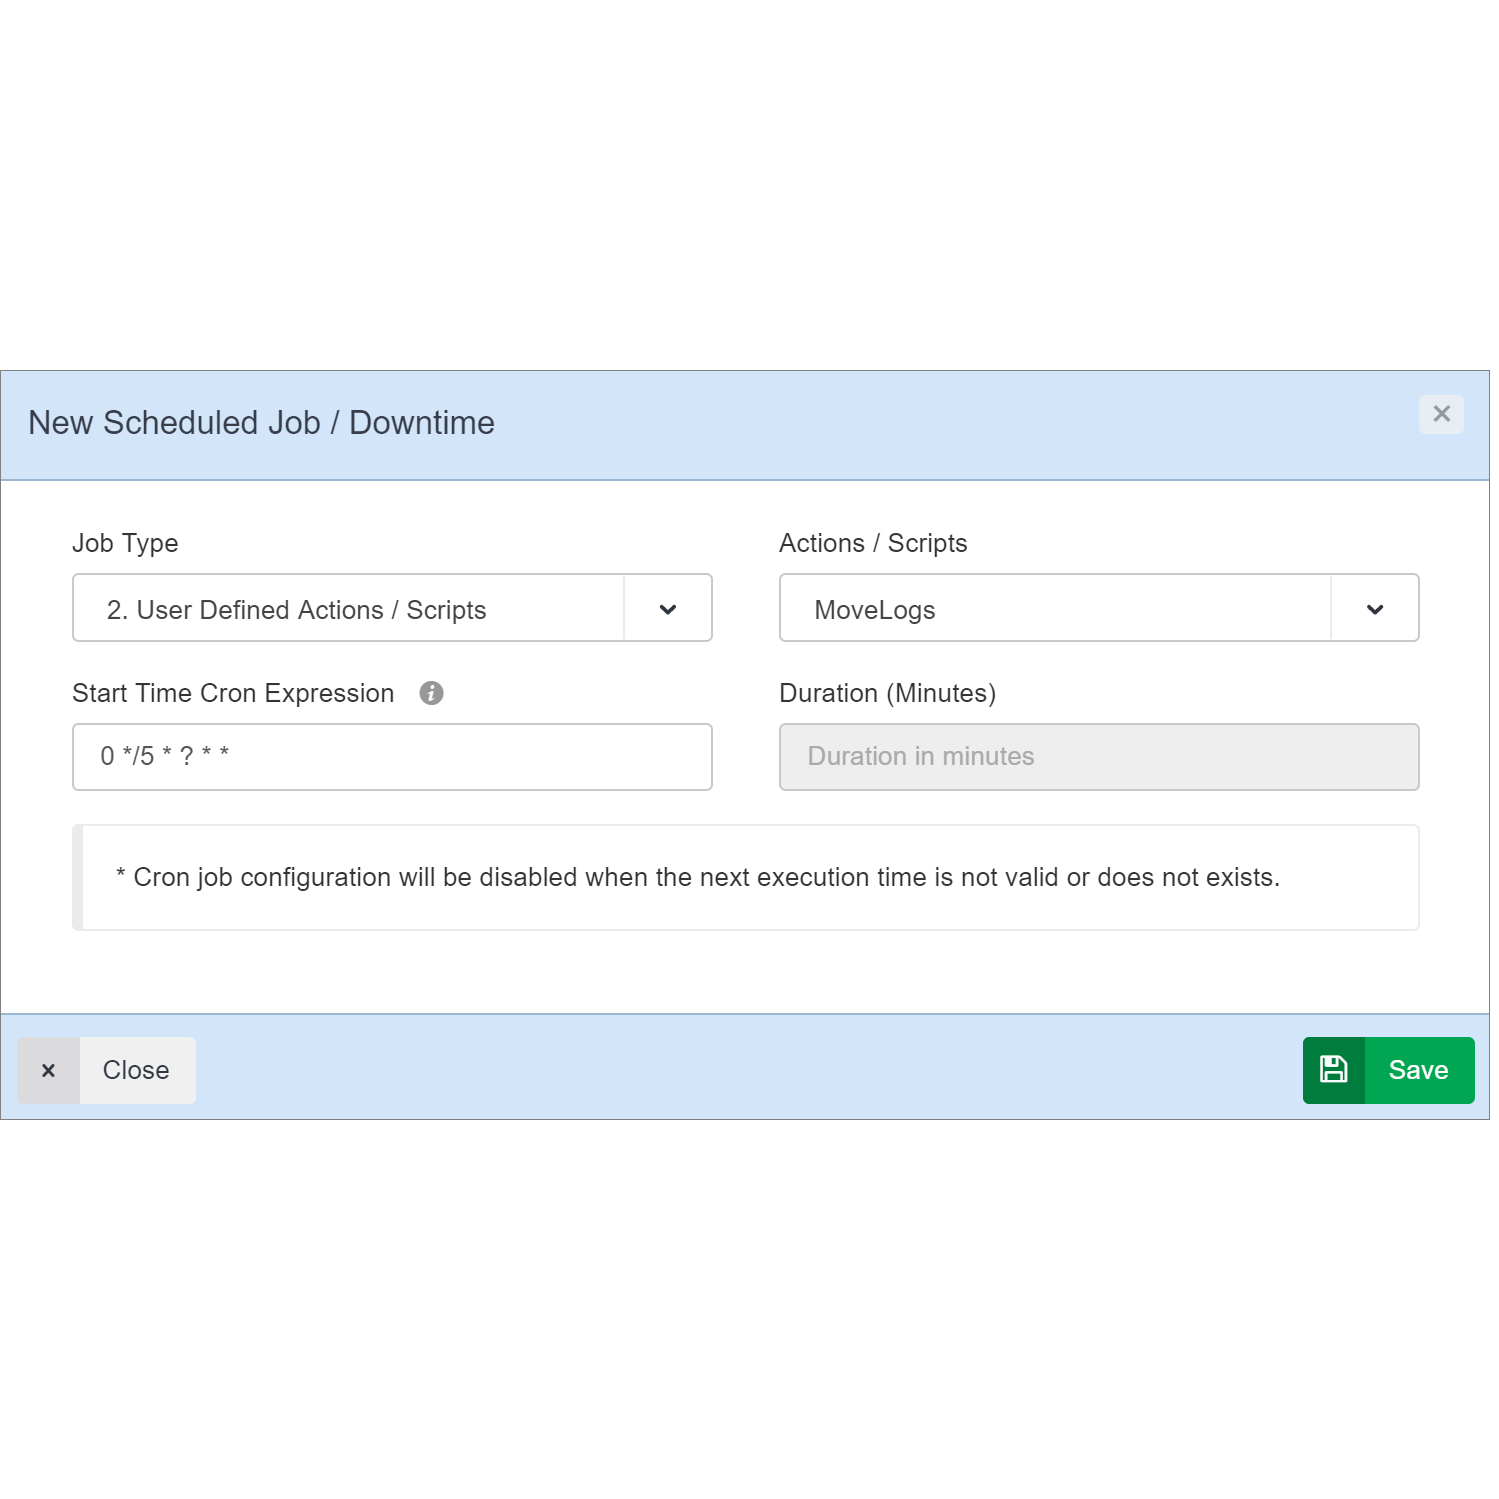
Scheduler Module
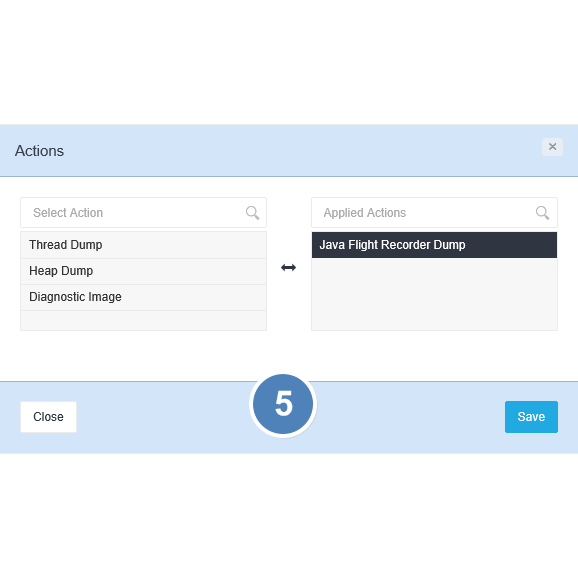
WLSDM Actions
Download and View Profiling Dumps
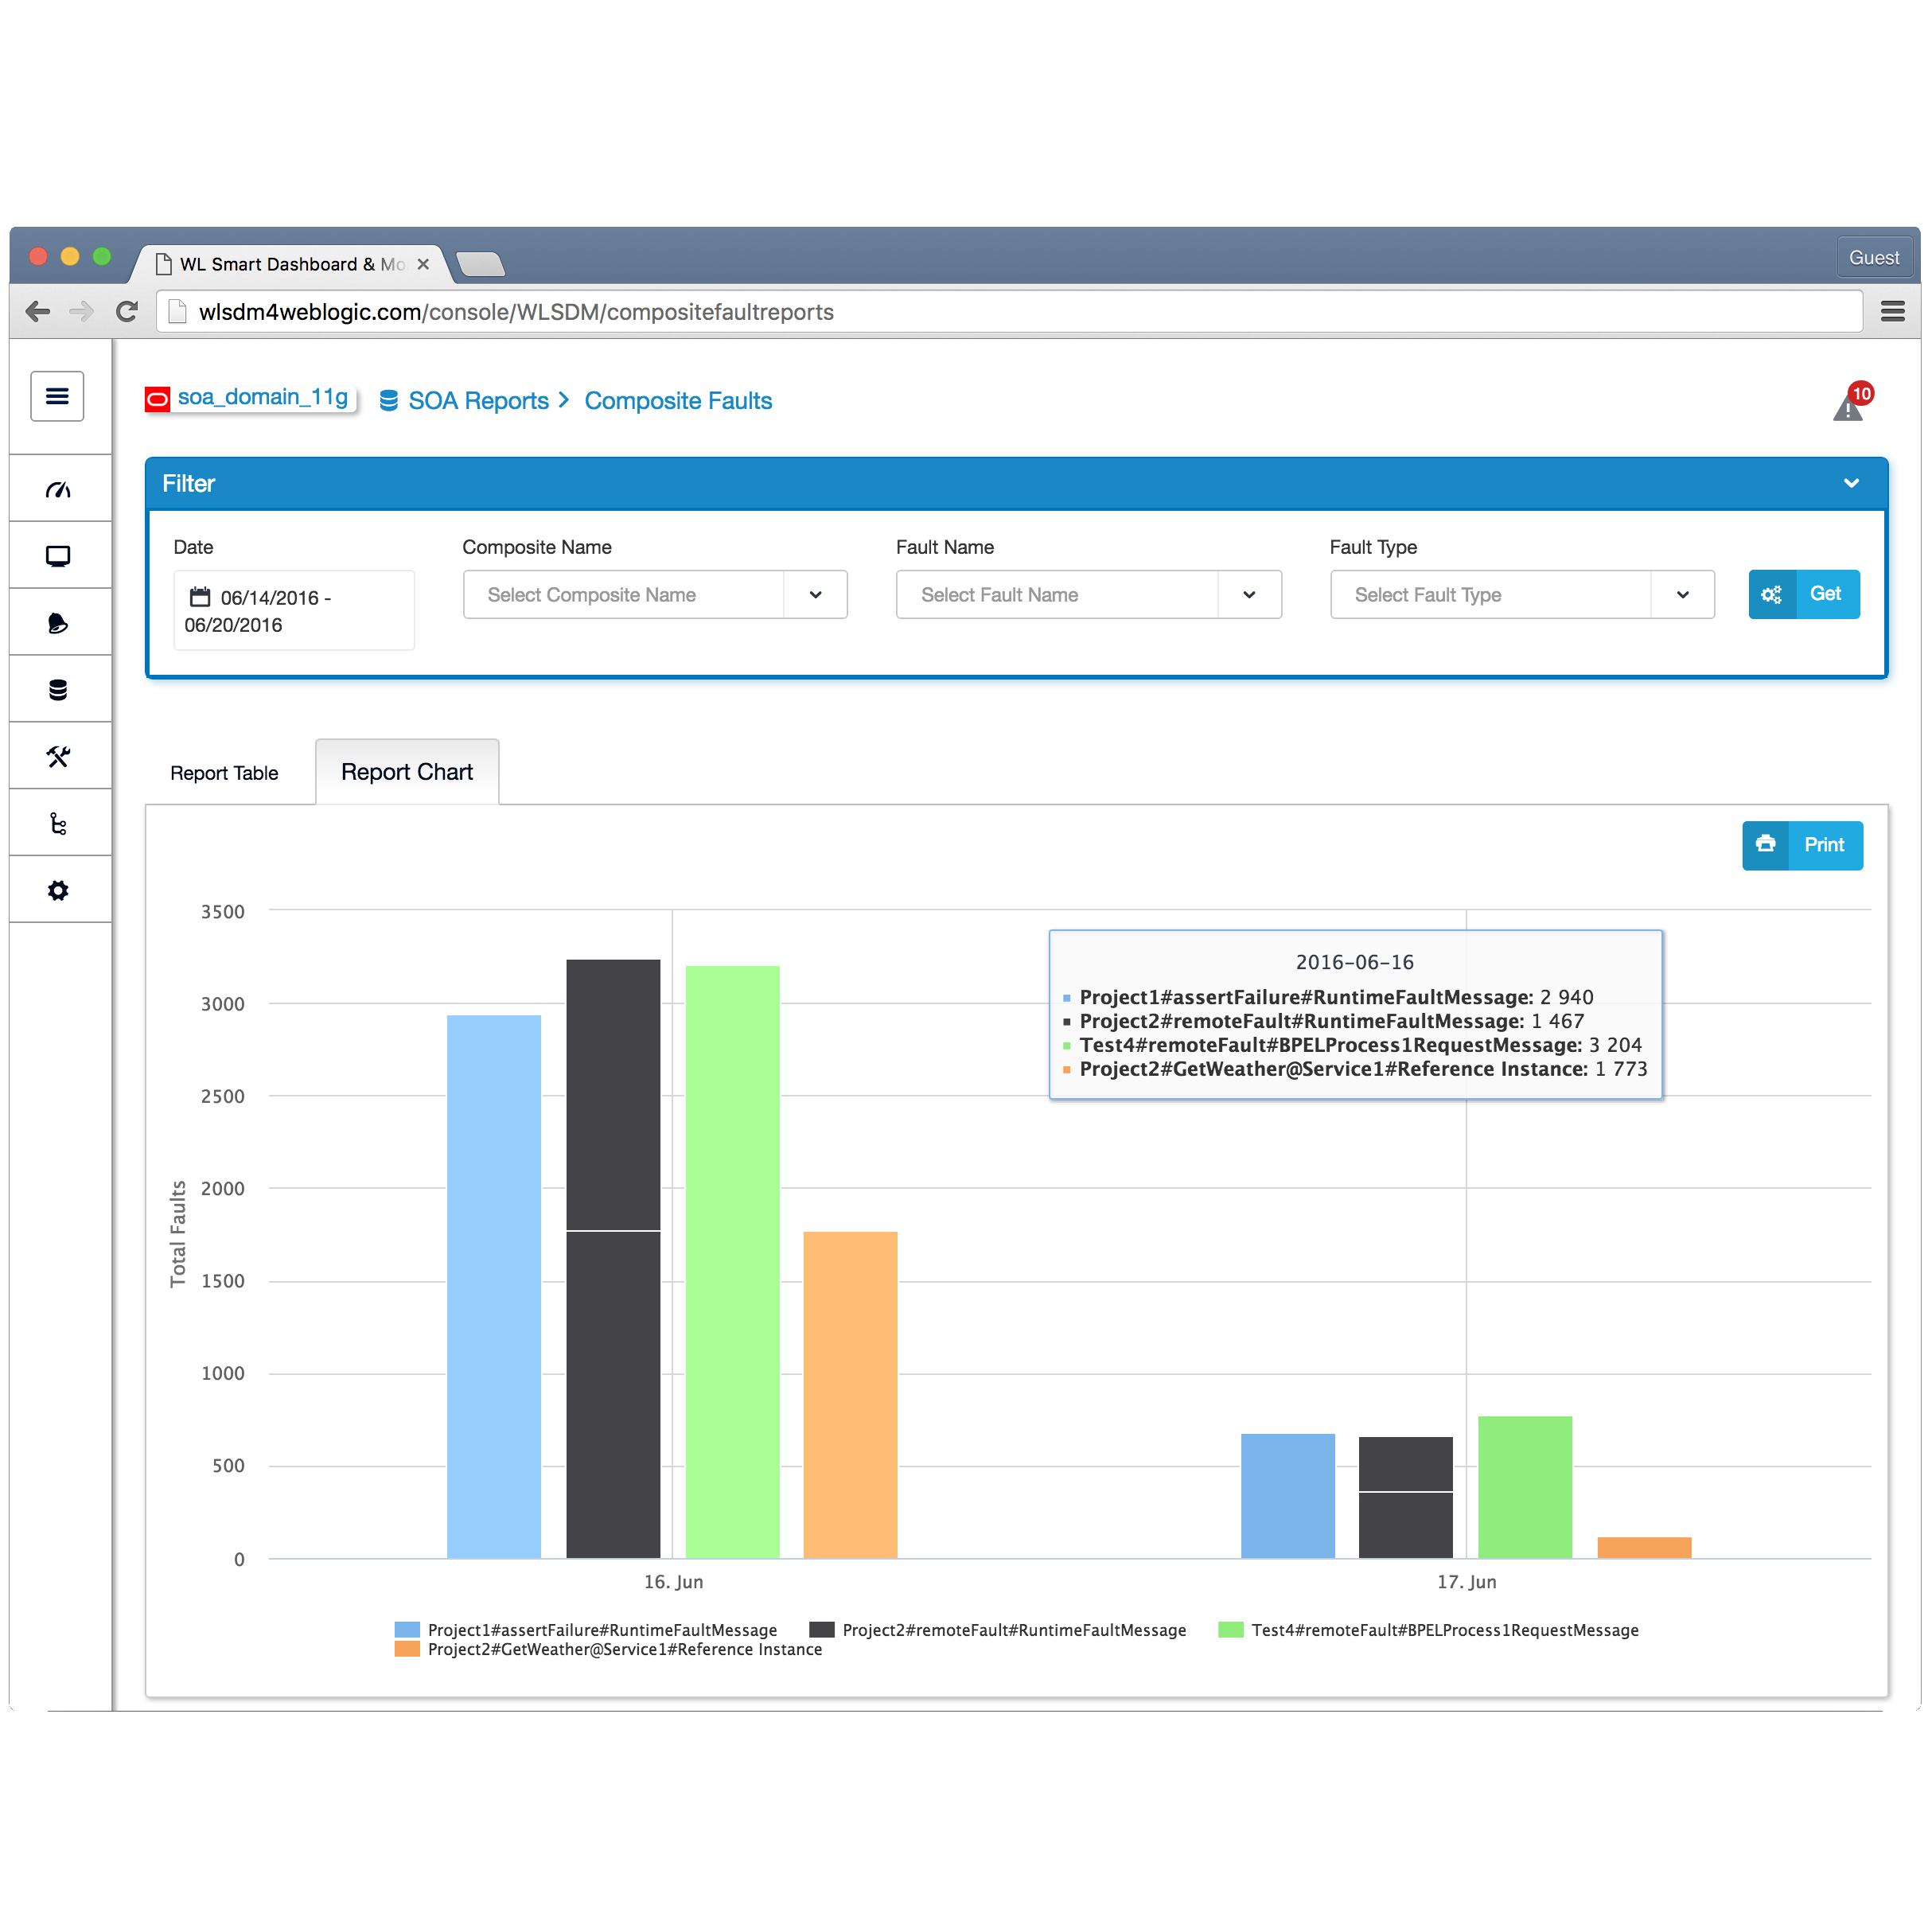
WLSDM SOA-Suite Module
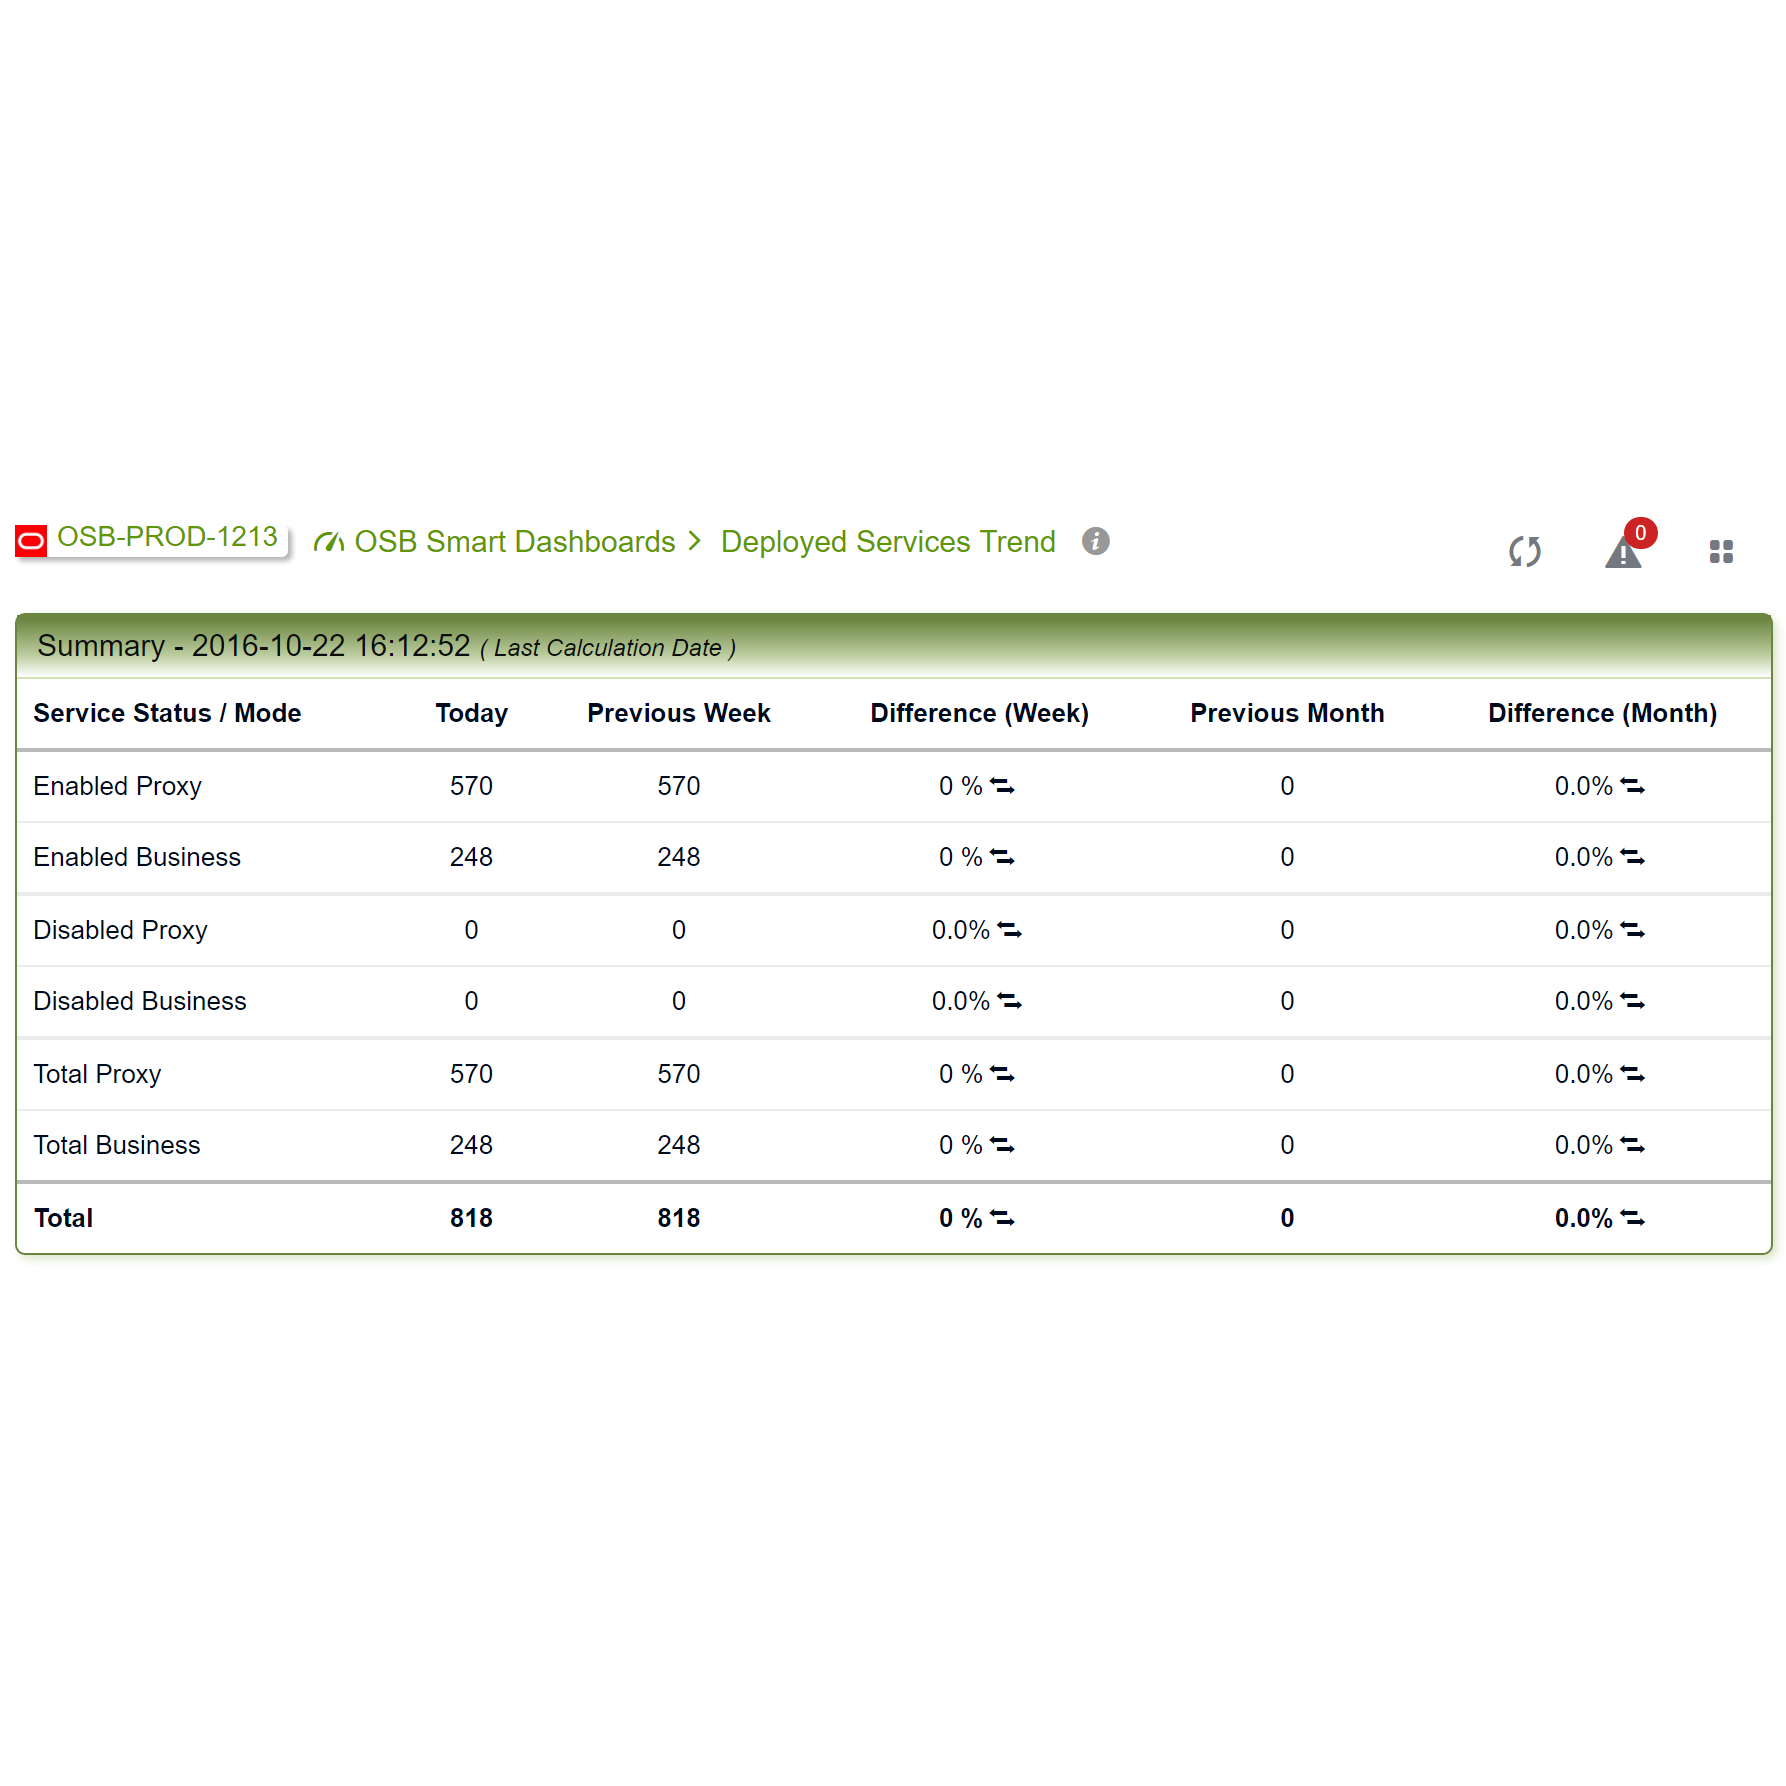
WLSDM OSB Module

I need to speak with sales...
I need to book an appointment...
I need to contact to support...